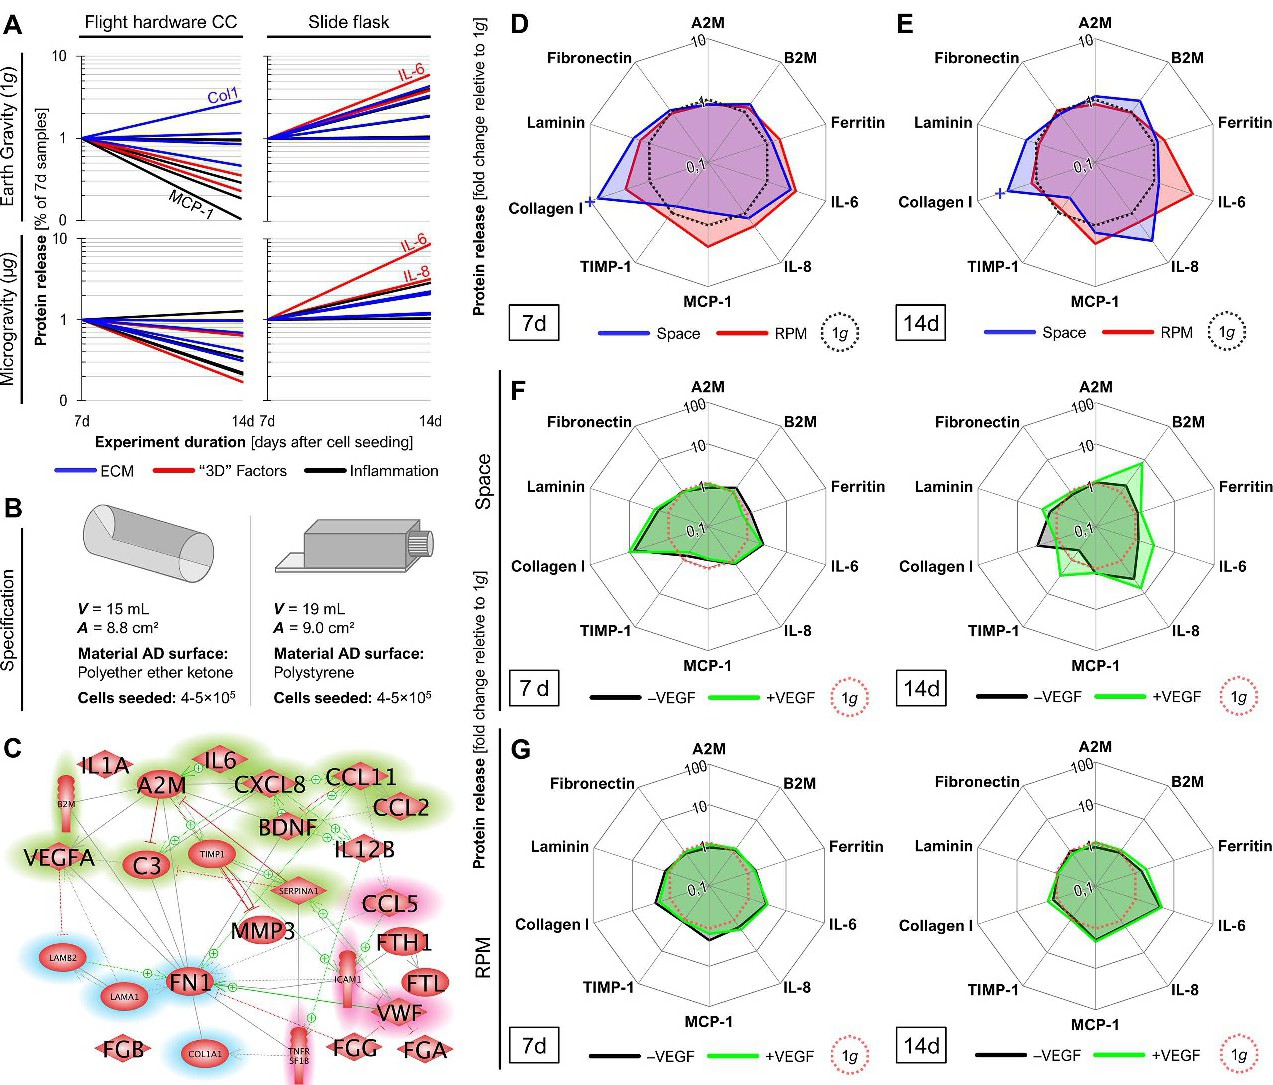
Fig. 4. Effects of microgravity on EC secretion behavior. A) Time courses of protein releases in the different cultivation chambers between day 7 and day 14. B) Specification of the constructed cultication chamber and commercial slide flasks. C) Mutual interaction of proteins analyzed by MAP technology (InflammationMAP(r)). Green background indicates released factors both in the hardware and in slide flasks, red background shows factors only released in slide flasks. ECM components are highlighted in blue. The green arrows indicate activating and the red one inhibiting effects. The interaction network was built up using Elsevier Pathway Studio v.11. D, E) Protein release profiles of ECs cultured for 5 d and 12 d under r- and s-µg conditions. Fold changes of protein secretion compared to 1g controls are shown in blue (space samples) or in red (RPM samples). + marks the minimum fold change, as protein levels were below the LLOQ. The LLOQ was used for comparison. The black dotted lines indicate the secretion levels under 1g (control) conditions. F, G) Protein release profiles of ECs cultured for 5 d and 12 d in space (F) and on the RPM (G). Fold changes of protein secretion in presence of supplemented VEGF are shown in green, without additional VEGF in black. The red dotted lines indicate the secretion levels under 1g (control) conditions. * P <0.05 vs. 1g.